

We strongly believe data is the next soil where opportunities are enormous. Every domain is generating a huge amount of data. One way to make sense of it other than storing it is to make data driven approach and helps organizations to take better decision with a proof in hand. Every cloud based systems cannot handle large data easily. So we have designed LitmusBi to stay in your operating environment.
Handle Large Data
We known just storing data for reference purpose is not only the use of historical data. We can process it and its not easily with MS Excel to handle that load. We fill this gap.
Better Visualizations
Data has multiple dimensions, till now most of data analytic products are using the same good old barchart, piechart, donut chart..etc. But currently its not sufficient to better understand the data. We need a third eye. LitmusBi comes with better visuals for better story telling.
Custom Implementation
We know every organization has different data structure or different data formats. Its always a challenge in generalizing data. So we have build LitmusBi Engine is such a way that custom implementation support is our core importance area.
Easy to integerate
We play and spend more time with LEGO. And we strongly believe the principles of it. So we adopted the same principle in building our LitmusBi engine. We can easily integerate with your data stores and allow it interface between you and your monster data store.
Outputs Of LitmusBi
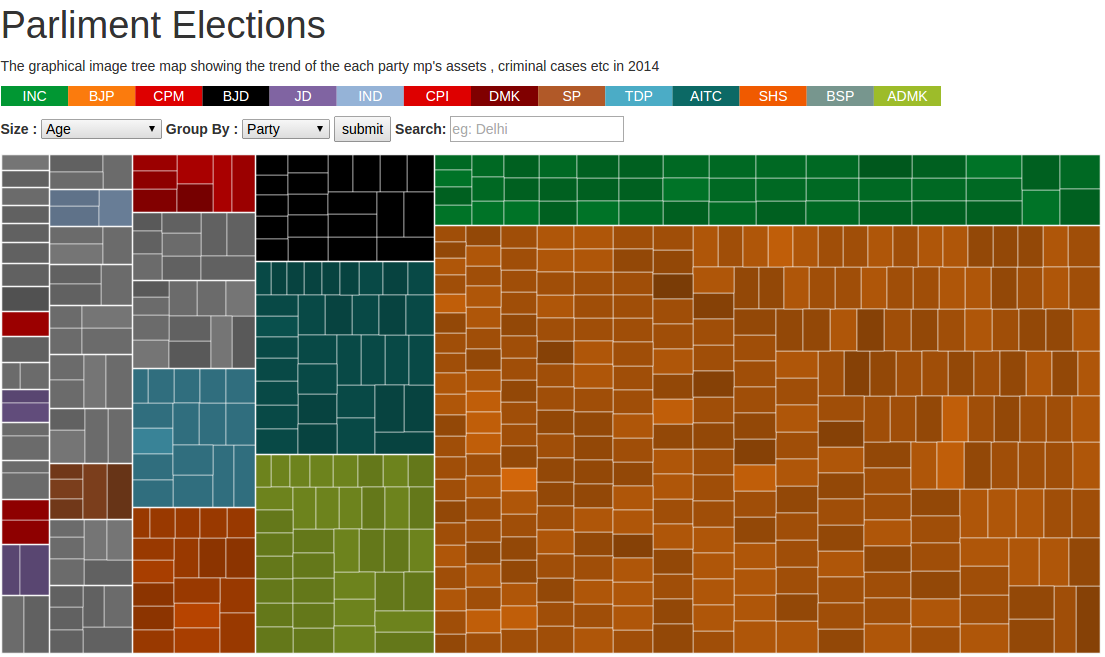
Election Analysis
The graphical image tree map showing the trend of the each party mp's assets , criminal cases etc in 2014
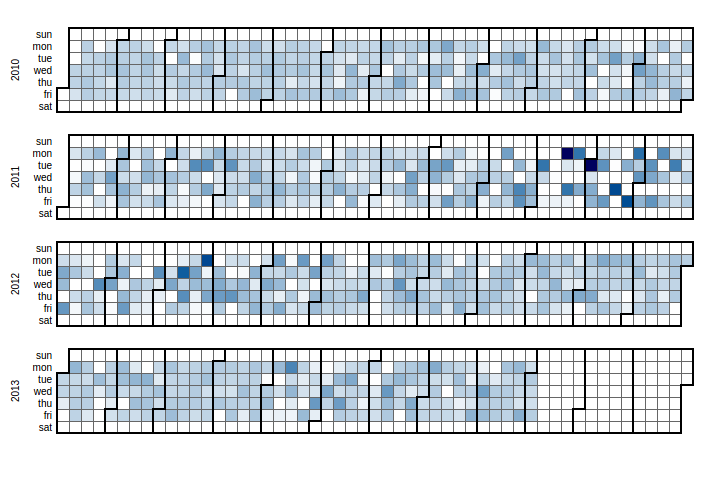
Daily Sales Report
Get the day to day sales insight from large dataset cruched to find the peak
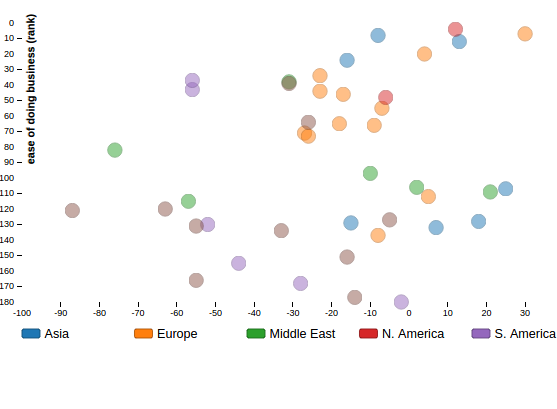
Trust Business Analysis
It maps social trust against ease of doing business in various countries.
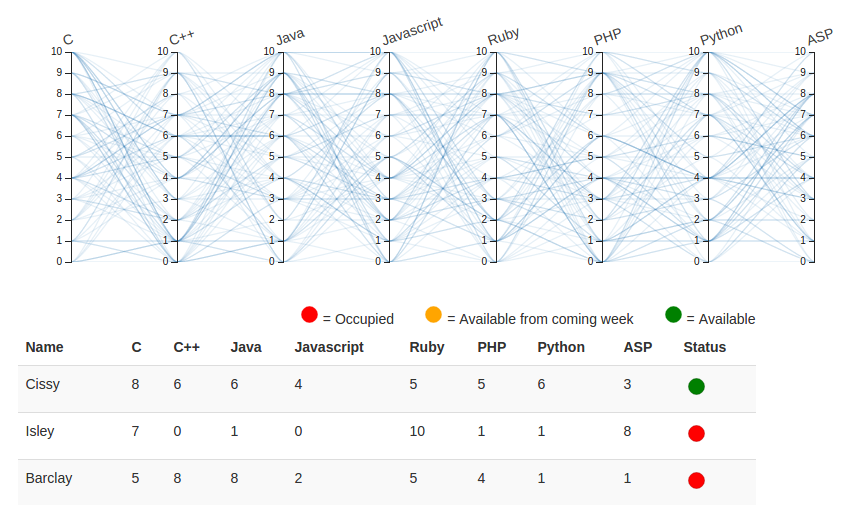
HR Project Allotment
Each employee is rated from 0 to 10 in each language. At the bottom of the visualization is a list of all the employees.
Built with LitmusBI:

Twitter Sentiment
A Twitter sentiment analysis tool built using LitmusBi Engine. Discover the positive and negative opinions about a product or brand
Predictive Analytics
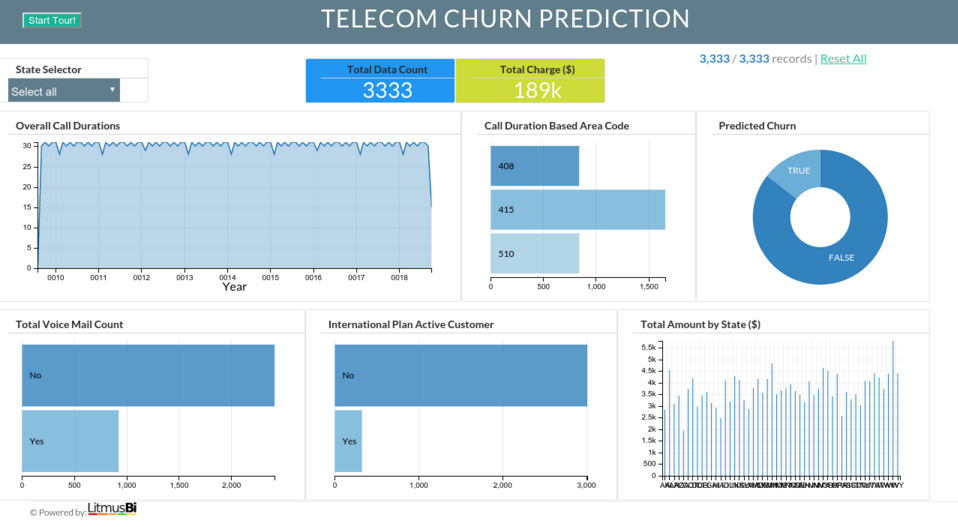
Churn Prediction
Predicting the Customer Churn Using LitmusBi which comes with Machine Learning And Deep learning API's. Its easy to drilldown into different levels of data to perform exploratory analysis.
Pricing
Single License
Get access to our LitmusBi Data Visualization Server with one year unlimited access
Our support team helps you to get started with building your dashboard*
- License Per Computer
- Initial customization by our developers*
- Charges apply for custom visualizations*
- 1 year of updates and support included
Custom License*
Custom license to our LitmusBi Data Viz engine unlimited access for one year
Our support team helps you to get started with building your dashboard*


